A new way to see Whistler Blackcomb; LiDAR Maps improve terrain resolution
Map IQ’s Whistler LiDAR Map
At Map IQ we love exploring in the outdoors. And we love having good maps.
When Fatmap met it’s maker in 2024, it got us thinking - Whistler Blackcomb’s maps really could do with a makeover.
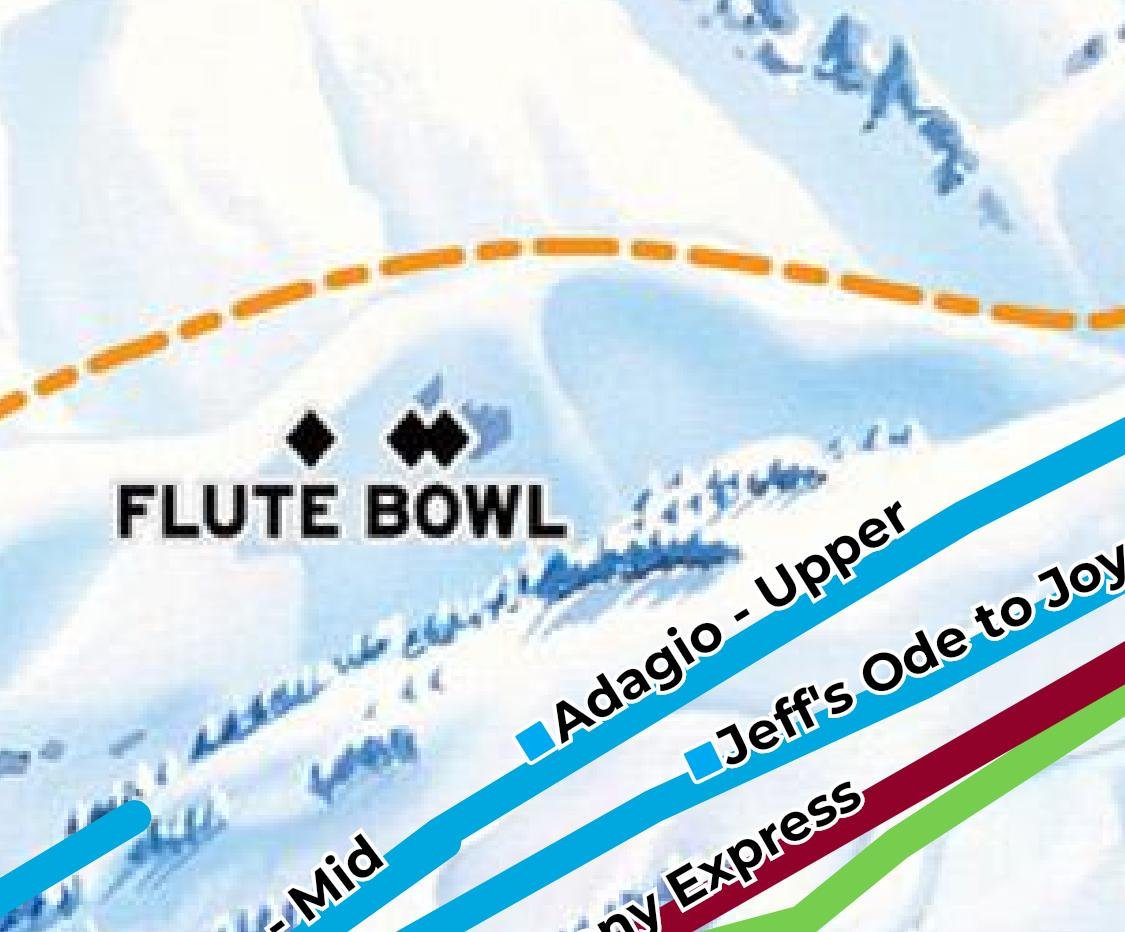
The resort’s own “My Epic App” map isn’t very useful - it just shows a (pretty) artist’s rendering of the area - but not to scale or with any relevant terrain info.
Credit; Vail Resorts. An example of (the pretty but pretty useless) flute bowl map rendering from the Epic Pass app.
Fatmap’s dead. Other alternative mapping apps show terrain at too low a resolution - not enough to see features.
This is where Map IQ’s Whistler LiDAR Map comes in.
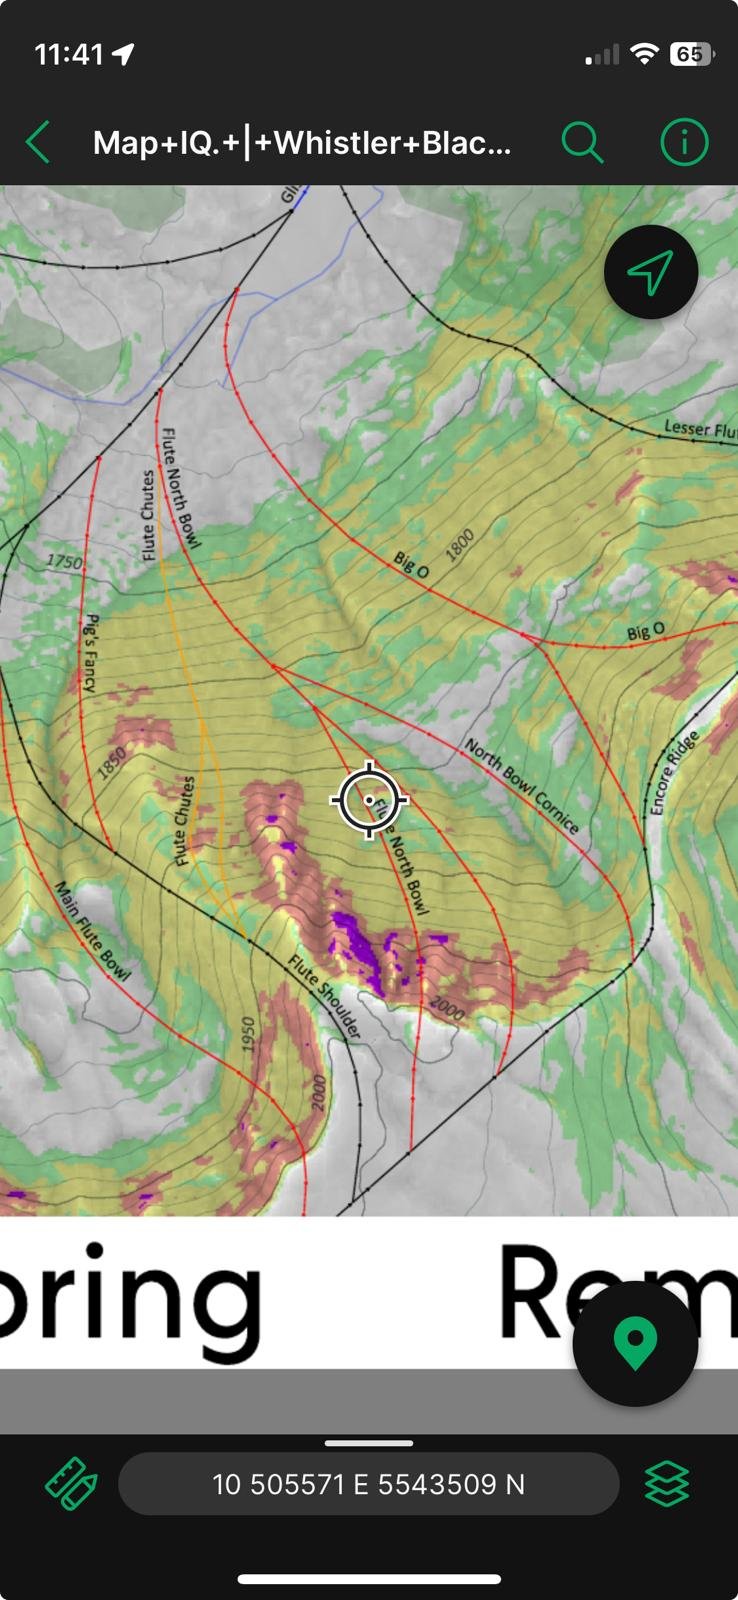
Screenshot from Map IQ’s LiDAR Map on the Avenza app.
Map IQ has created a first (to our knowledge) for Whistler Blackcomb - terrain and slope maps for the resort and slackcountry areas using aerial LiDAR data.
The map is completely free, offline-capable, geo-referenced, and allows you to plan tracks, save waypoints, and create routes in the Avenza app. It shows 10m contours, categorized slopes, as well as the usual ski resort information. It’s also shaded to show steep/enclosed terrain on all aspects.
Comparison between Map IQ’s LiDAR Map and FatMap (right) at Flute Bowl. The LiDAR Map provides a higher level of detail on terrain undulations and features, showing gradient categories, accurate contours, and terrain shading. Right image credit: Fatmap
Tech Details
For the nerds out there, here’s some background on LiDAR. Airborne LiDAR is about the most accurate form of terrain measurement for this scale of mapping. It involves flying passes over the target area—by drone, helicopter, or airplane—with an expensive LiDAR payload.
While the owner of the data used in this map hasn’t provided us the raw data or metadata, we’re guessing (based on the capture date) that it was collected by airplane at a rate of approximately 1–4 laser pulse/beams per square meter, from a flying altitude of around 3000 m. Almost every square meter of terrain will have been hit by a laser pulse.
Note that lasers can only see through gaps in tree cover. If you’re in a heavily forested area, there’s a chance that a laser only made it to the ground every 10 or 20 m, lowering the effective resolution there. Like any remote sensing data, you need to consider these limitations when deciding if it’s right for your purposes.
About Map IQ
And a plug for Map IQ - we are spatial data consultants and surveyors specializing in LiDAR and remote sensing data capture and management.
If you have a project needing survey, or you have ideas about how this kind of data could be used elsewhere, let us know!
Lakeside Bowl and DOA from Map IQ’s LiDAR map
Important Information
As with any map or spatial dataset, there are some things to keep in mind regarding its limitations.
Make sure you read the following info and the disclaimers at the end—and check the notes in the map legend before using.
- the data presented is a compilation of publicly available information, and hasn’t been extensively ground truthed.
- The LiDAR data was captured in 2014 - the landform is likely to have changed in some places in the past 10 years.
- The runs/tracks shown are derived from openstreetmap - as you’ll see when comparing them to the more accurate LiDAR data, there are some errors in the position of the openstreetmap runs, sometimes up to 50m off.
- the map won’t be as reliable in heavily forested areas (think tight tall trees). In these areas there will have been less ground measurements achieved by the LiDAR survey.
- The LiDAR data was likely collected between spring and autumn. If so it will have captured a combination of ground and residual snow on northern aspects and at higher altitudes. So it is not an exact representation of the landform you’ll see in a mid-winter 3-4m snowpack with variable depths due to avalanche, windloading, melting etc.
Disclaimers
The information provided on this map is compiled from a variety of sources and is offered for general reference only. No guarantee—express or implied—is given regarding its accuracy, completeness, reliability, or suitability for navigational purposes.
By using this map, you acknowledge and agree that backcountry exploration and outdoor activities involve inherent risks. You assume full responsibility for any injuries, damages, or losses (whether to persons or property) that may result, directly or indirectly, from your use of the information contained in the map.


